
Garbage-Time Yards Can't Rescue a Bad NFL Season—Here's How to Tell
GOATIFYAn NFL quarterback can finish a disappointing Sunday with 310 passing yards and still leave the most important question unanswered: how well did his offense function while the game was in doubt? Those yards all count in the official record. But a late barrage against a defense protecting a comfortable lead does not necessarily erase sacks, turnovers and failed drives that made the comeback so improbable in the first place.
The distinction matters when evaluating an entire season, not just one memorable loss. A quarterback on a team with a struggling defense might spend more time trailing without being responsible for every deficit. Another might generate attractive totals only after his offense repeatedly falls behind. Labeling both players “stat padders” is lazy; declaring every 300-yard performance a success is just as lazy.
The solution is to define garbage time before inspecting the box score, compare production inside and outside meaningful game states, and use more than one measure of offensive impact. Through Week 10 of the 2026 season, passing leaders and individual results make this a timely test of how we discuss NFL quarterbacks. The aim is not to delete legitimate yards. It is to understand what those yards can—and cannot—prove.
Garbage Time Needs a Definition, Not a Feeling
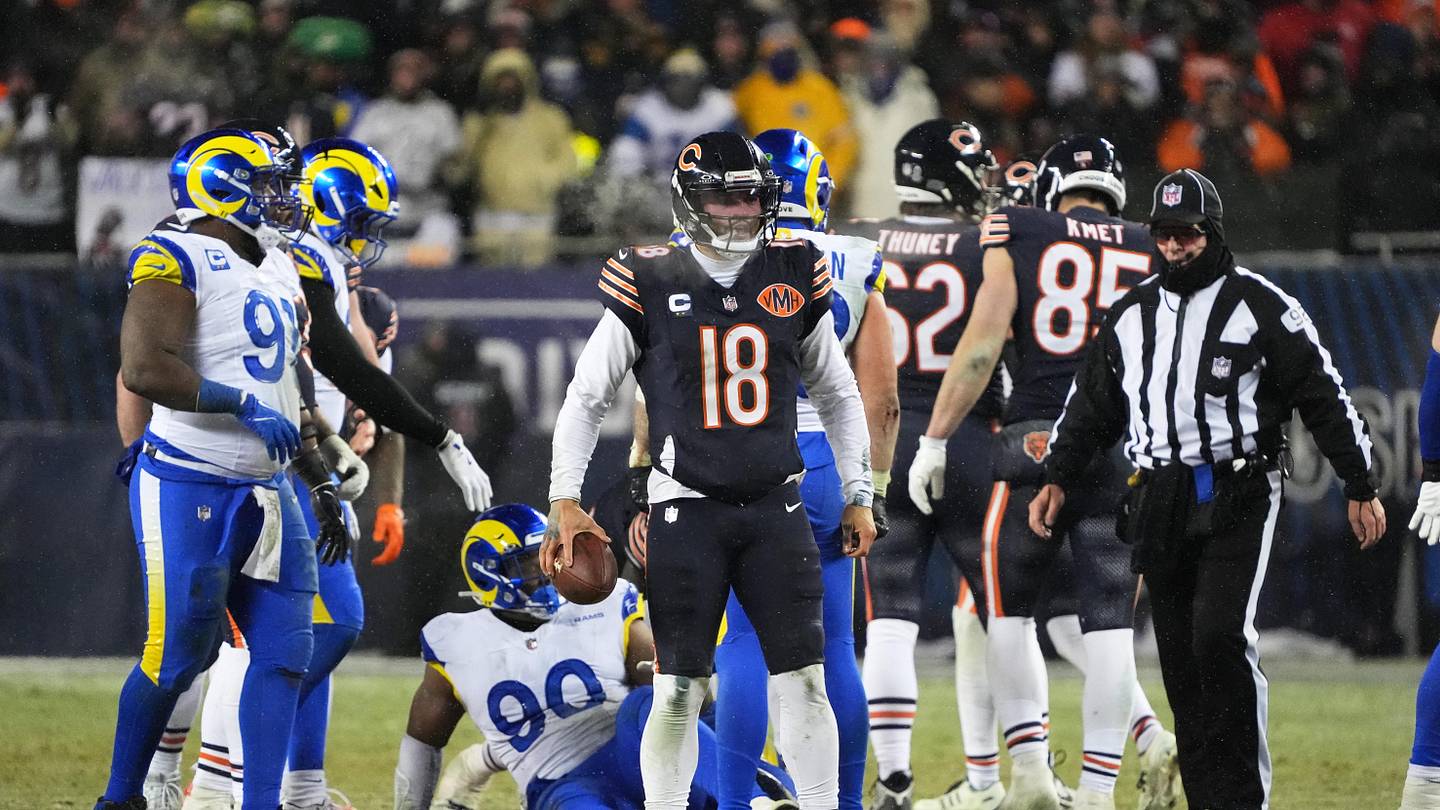
A passing box score shows what happened. It does not tell you when the defense was willing to permit it. When a quarterback throws for 325 yards in a defeat, the number can describe three very different afternoons: an excellent performance undermined by the defense, a poor first three quarters followed by easy completions against a soft shell, or a genuine rally that nearly changed the result. The final total alone cannot sort those possibilities. Calling every yard after halftime “garbage time” is just as misleading.
Start with an explicit game-state rule. One workable analytical screen labels a passing play low-leverage when the offense’s pre-snap win probability is below 10% or above 90%. That is a reasonable comparison window, not an official NFL rule. A stricter research example excludes plays when win probability is below 5% or above 95%, with separate exclusions for the final two minutes of a half. Both approaches have merits, but their results are not interchangeable. State the threshold before presenting any ranking, or a convenient statistic becomes a moving target.
Why use a probability instead of a fourth-quarter point margin? Because a 17-point deficit with thirteen minutes left is not the same as a 17-point deficit with 90 seconds left. Timeouts, possession, field position and which team owns the ball all change the chance of a comeback. A team that trails by nine with the ball and five minutes to go still has a plausible route; the same gap without possession and almost no clock has a different meaning. Analysts should evaluate the situation before the snap, not label the play retroactively because the result became inevitable.
A different 2026 quarterback leaderboard uses a score-based garbage-time filter: margins greater than 38 points in the second quarter, 28 in the third or 22 in the fourth. Those deliberately wide blowout thresholds preserve more comeback situations than a 10–90% win-probability filter. Neither deserves to be silently substituted for the other. If one chart uses win probability and another uses quarter-specific score margins, a change in a quarterback’s standing may reflect the filter as much as his play.
There is also an important asymmetry. A defense protecting a 24-point advantage might trade five-yard underneath receptions for clock. The offense taking those gifts still needs to execute, and that execution should not be erased from the official record. But it is not equivalent evidence of quality to beating tight coverage on third-and-eight in a one-score game. This is a question of the information each play provides, not whether an athlete worked hard enough to earn the yards.
GOATIFY
GOATIFY NFL
Game-state context changes what a passing total means. Explore GOATIFY NFL fan apparel and football gifts for the next kickoff.


The practical rule: preserve the full box score for historical accounting, then split competitive and low-leverage plays for evaluation. Report both the cutoff and the share of attempts it removes. If a sample loses only six dropbacks, dramatic claims about a newly “exposed” quarterback are unearned. If it loses eighty attempts, the filtered average deserves attention—but it still requires context, a sample size and a look at the film.
Big Passing Totals Hide When the Yards Arrived
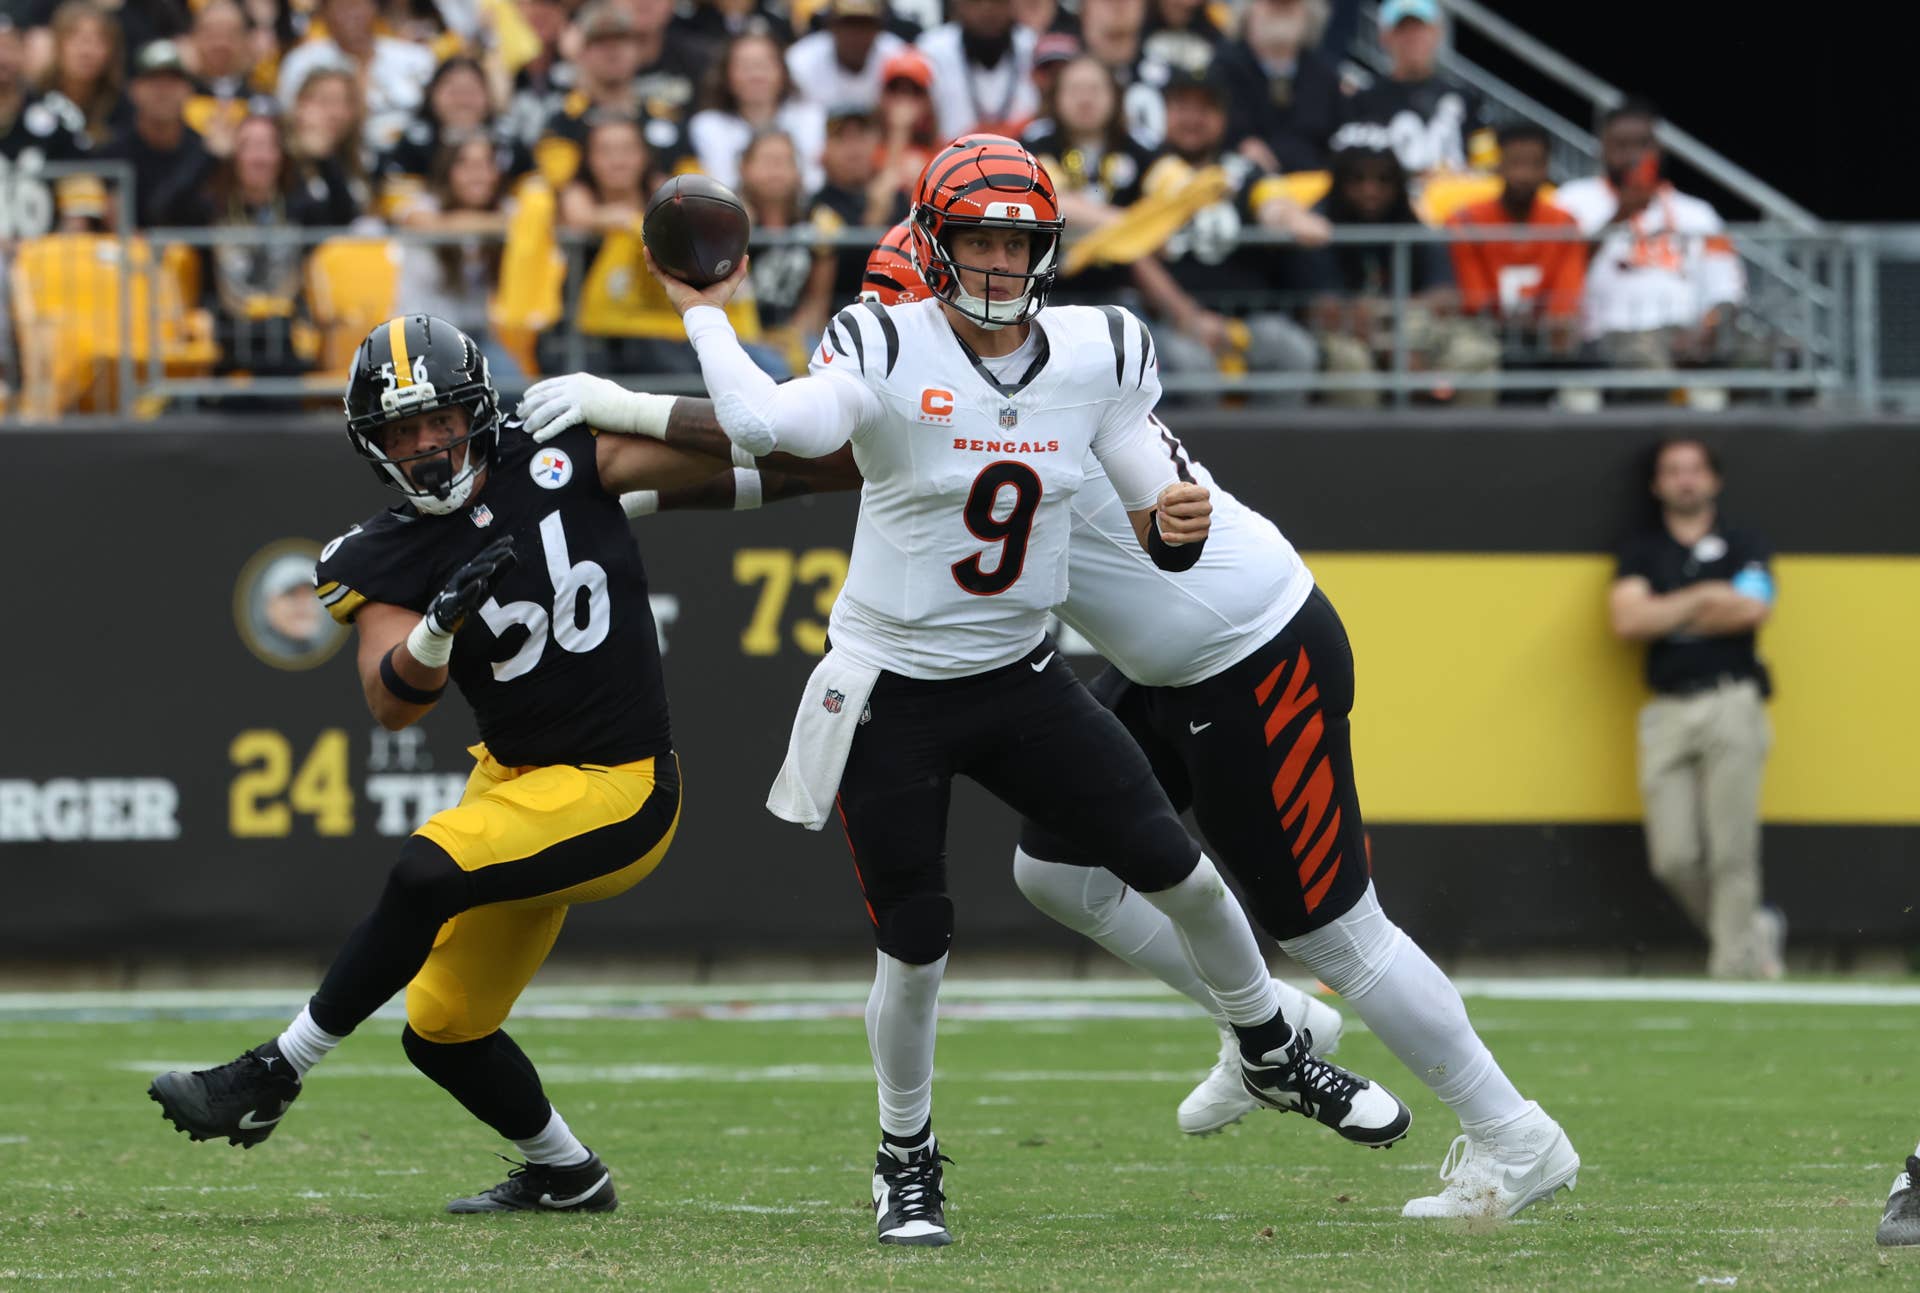
The 2026 passing leaderboard offers a useful warning against treating volume as a verdict. Through Week 10, Jordan Love had 2,838 passing yards and Joe Burrow had 2,795, with Dak Prescott also above 2,700 in the published season totals. These are legitimate yards. They do not, by themselves, establish which quarterback produced the most value when the outcome was uncertain. Attempts, sacks, starting field position, opponent strength and the flow of individual games are missing from a raw-yardage comparison.
Consider the way a blowout distorts a single afternoon. Suppose a team trails 31–7 after three quarters and its passer adds 115 yards against a defense explicitly trying to deny quick scoring plays. If he finished with 300 passing yards, the late production is more than a third of the total. The yards count. But the inference “he played like a 300-yard quarterback” skips the very stretch in which the offense lost contact with the game. This is a hypothetical example, not a claim about any named 2026 player.
Now reverse the example. A passer throws for only 205 yards in a victory built on short fields and a powerful rushing attack, yet repeatedly converts important third downs, avoids sacks and protects a late lead. He might have contributed more to the win than the passer with 300 yards in the blowout. A useful comparison does not simply replace one number with another; it asks why the volume exists and what it bought at the times it mattered.
Even an actual 2026 result demonstrates why the final line cannot supply the full answer. Minnesota beat Green Bay 30–10 in Week 10 while the Packers surrendered eight sacks and four turnovers. Jordan Love’s season yardage remained substantial, but that particular game was shaped by pressure, giveaways and failed possessions. None of that means every Green Bay completion was empty, and the box score alone does not identify the exact snaps to exclude. It means the score, pass protection and play sequence must accompany any evaluation of that passing performance.
There are two tempting shortcuts to reject. One is to dismiss all yards by losing teams, which unfairly penalizes quarterbacks whose defense or special teams repeatedly gives away points. The other is to say every late touchdown proves resilience. Sometimes a late touchdown makes a game competitive again; sometimes it changes only the final margin. Whether it improved the actual chance to win, and how difficult the drive was, are separate questions. Fourth-quarter production is not automatically worthless or automatically heroic.
The right dashboard therefore starts with total yards and attempts, then adds passing efficiency and a game-state split. Keep a note about late opponent substitutions, prevent coverage and any possessions that started on unusually short fields. An analyst who discloses the circumstances can still praise a quarterback for throwing for 300. The praise just becomes narrower, more accurate and harder to manipulate for a highlight reel.
GOATIFY
GOATIFY NFL
Big yardage totals only tell part of the story. Find GOATIFY football shirts, hats and fan accessories.
EPA, Success Rate and Third Downs Show What Volume Hides
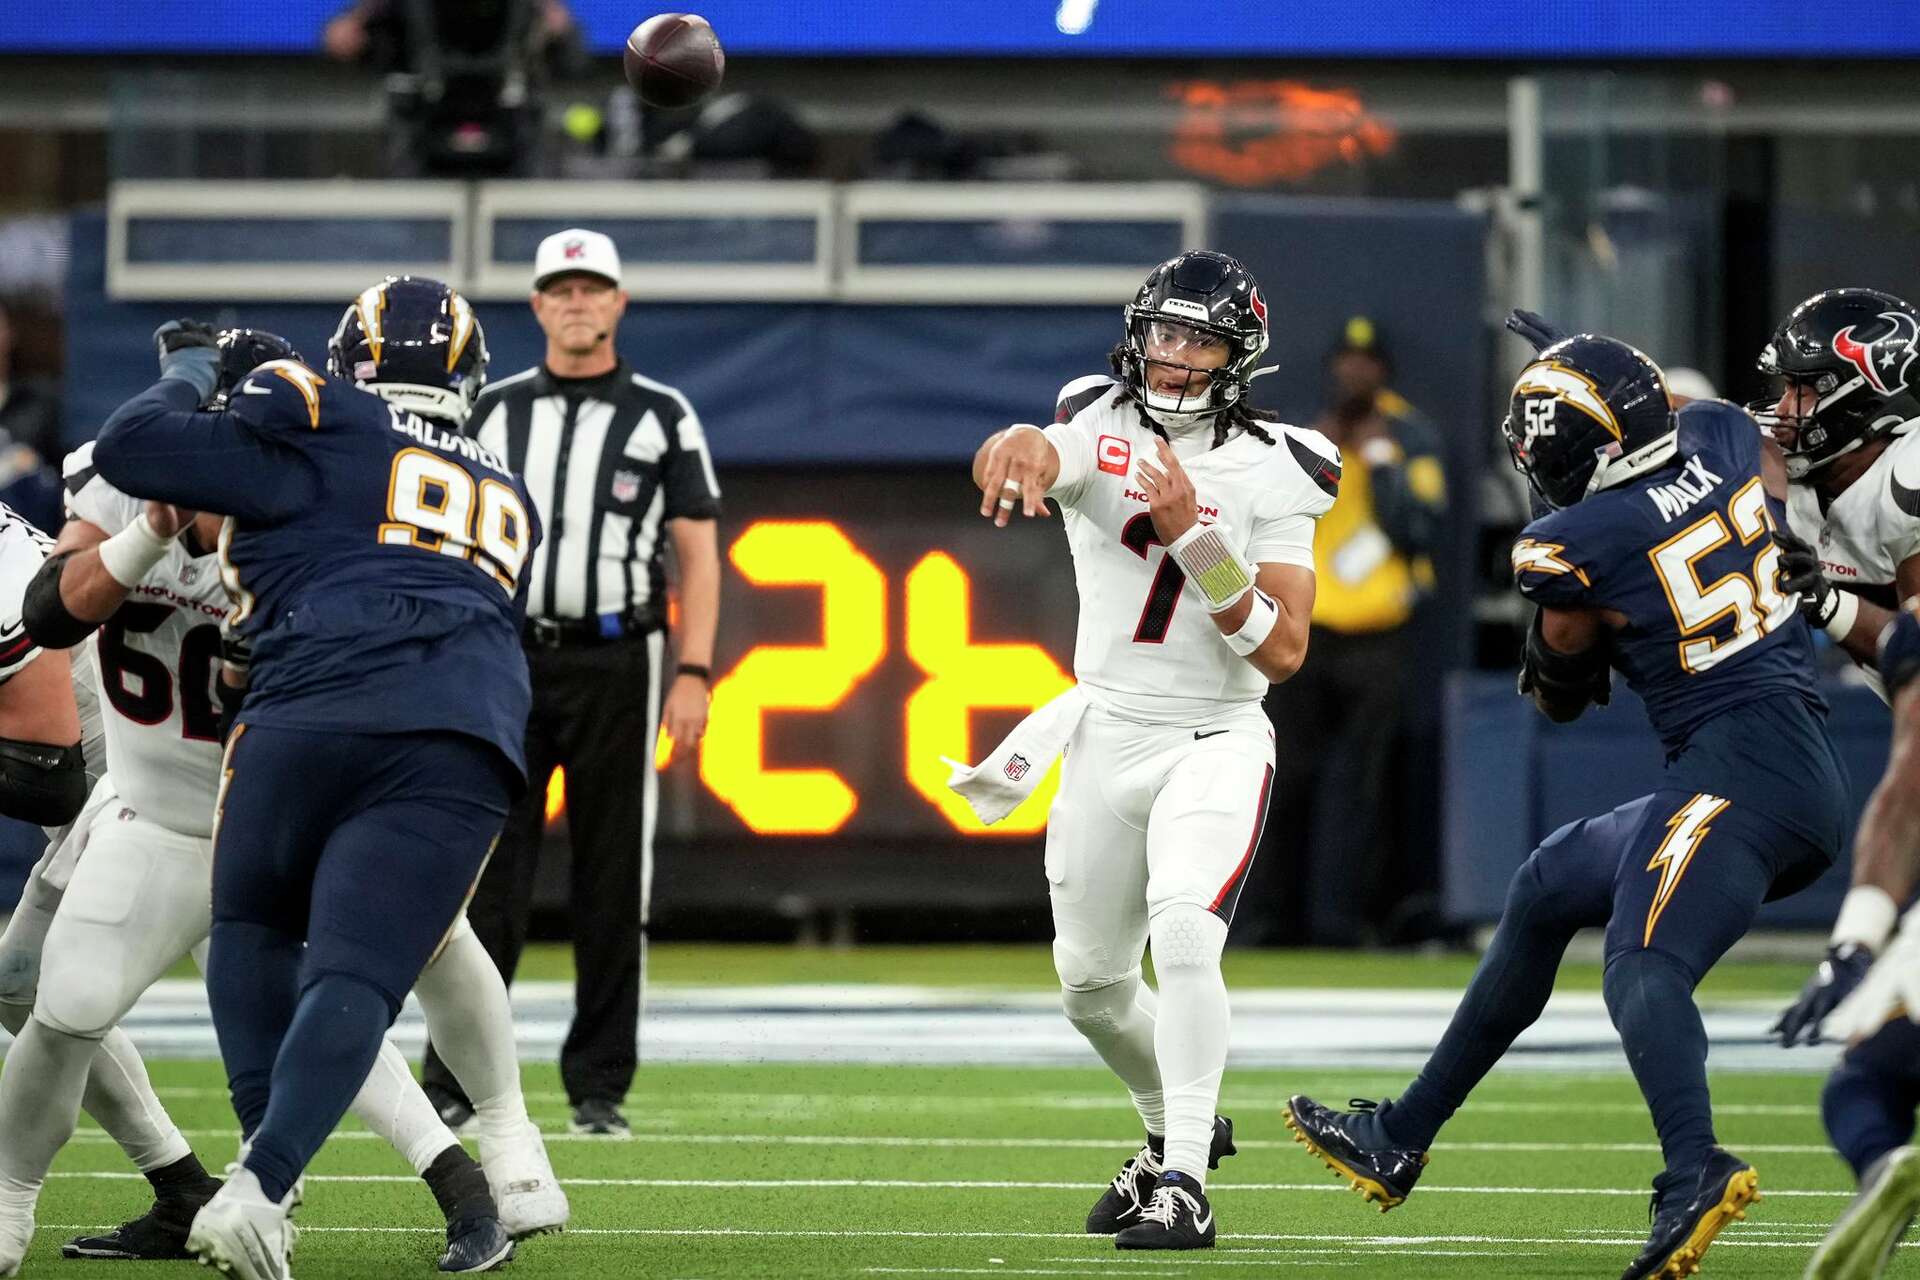
Expected Points Added, or EPA, gives analysts a stronger starting point than raw yards. It asks how much a play changed a team's expected point value given down, distance, field position and other game conditions. A four-yard completion on third-and-three can move the chains and meaningfully improve the offense's position; a four-yard completion on third-and-twelve often does neither. The official next-generation passing framework uses EPA alongside measures of throw difficulty and accuracy because none of them can be replaced by counting yards.
For garbage-time analysis, compute at least two efficiency lines: EPA per dropback on every qualifying play and EPA per dropback with clearly identified low-leverage snaps excluded. Also compare success rate, which focuses on how frequently an offense produces favorable play outcomes rather than how large its occasional gain becomes. A quarterback can survive on a few explosive throws while producing too many empty downs; another can keep an offense on schedule without reaching the same yardage total. Both patterns are visible once efficiency and consistency are shown together.
One published 2026 non-garbage-time leaderboard, using a quarter-specific blowout-margin screen, listed Brock Purdy at +0.34 EPA per dropback, Josh Allen at +0.31 and Trevor Lawrence at +0.30 when checked for this article. Those are provider-calculated figures, not an official NFL award table. Their value here is to demonstrate that serious evaluation can publish an explicit rule and give the resulting split, not to crown an MVP on a single model. Before comparing two services, confirm that sacks, scrambles, kneeldowns, penalties and filters are treated the same way.
Sacks deserve particular attention because traditional passing yardage does not subtract a quarterback's sack losses. A passer who produces several impressive deep completions while repeatedly losing yards and possessions under pressure can look far better in the headline passing-yard total than the offense did in reality. The offensive line bears part of that responsibility, of course. That is why sacks are evidence to investigate, not an automatic individual conviction. Pressure-to-sack rate, average time to throw and film review help separate bad protection from a quarterback who creates problems himself.
Third-down conversion, red-zone possession quality, turnovers and drive outcomes add another layer. A 45-yard throw on first down is valuable when it creates a scoring opportunity; it is less decisive when the following three snaps lose the ball or the drive stalls. Likewise, a long completion against prevent coverage with 20 seconds left can be technically impressive yet add almost nothing to the win probability. The point is not to reduce football to a single mathematical score. It is to prevent one easy-to-advertise total from crowding out the rest of the evidence.
Be careful with small samples and opponent effects. A quarterback facing a string of excellent defenses or losing multiple starting receivers may have a worse filtered EPA than his underlying ability warrants. A backup taking over with a 28-point lead might post flattering efficiency against tired defenders. Report attempts and dropbacks alongside any rate, compare the same period across seasons when possible, and say what the model cannot see. An honest football argument is more convincing when its limitations are visible.
A Real Comeback Is Not Garbage Time—and Context Is Not an Excuse

A comeback is the obvious exception that destroys lazy definitions of garbage time. A team can trail by multiple scores late and still mount a meaningful rally. If a passer creates real scoring chances, forces the defense back into aggressive coverage and raises his team's chance of winning, those yards belong in the competitive-performance conversation. The correct test is the pre-snap probability or another clearly specified game-state rule, not whether fans had already switched channels.
GOATIFY
GOATIFY NFL
EPA and high-leverage downs reveal more than box scores. Browse GOATIFY NFL gifts and football fan gear.
This cuts in both directions. A losing quarterback should not receive blanket immunity from criticism just because his defense gave up 35 points. He can still be evaluated on early-down choices, sacks avoided, turnover-worthy decisions and meaningful drives. But a passer who kept scoring while his defense repeatedly failed is not automatically a stat-padding fraud. Blaming the quarterback for the score while ignoring the score's causes reverses the logic of the analysis. Use the film and possession history before choosing a villain.
The 2026 schedule already gives contrasting reminders. Kansas City beat Atlanta 35–13 in Week 10 as Patrick Mahomes threw five touchdowns and 348 yards. That large output occurred in a victory; it would be absurd to imply the yards were meaningless merely because the final margin was wide. On the same weekend, Minnesota beat Green Bay 30–10; that score tells us the Packers struggled, but it cannot tell us how many specific Love dropbacks were truly outside comeback range. To answer either question properly requires a snap-by-snap timeline.
The same caution applies to receivers and running backs. A wideout collecting six short receptions against a defense willing to surrender the middle of the field has a different context from one winning contested catches against tight man coverage in a tied game. Running backs gaining yards while an opponent prioritizes passing defense also operate under different incentives. For fantasy football, all legal yards and touchdowns remain real scoring events. For personnel decisions, award debates and evaluating a losing season, the game-state split matters more.
A practical presentation should include a three-column comparison: full-season production, competitive-state production and the portion occurring in low-leverage situations. Then add EPA per dropback and success rate for the competitive sample, with a note about opponent quality. Do not call the low-leverage percentage a moral defect. A high share can reflect poor team defense, injuries, bad special teams, difficult schedules or truly ineffective early offense. The percentage invites questions; it does not answer them.
Finally, distinguish volume from accountability. Coaches need to know whether a quarterback can lead functional drives before the game is lost, whether his mistakes caused the deficit and whether late efficiency survives when the defense is still hunting stops. Fans deserve the same distinction. Not every fourth-quarter touchdown is cosmetic, and not every 300-yard loss is a hidden masterpiece. The best evaluation credits the difficult completions, discounts the cheap ones in context, and refuses to turn a single tidy number into the entire season.
Garbage-time yardage is not fake. A completed pass still requires a throw, a catch and a spot on the field. But the circumstances affect how strongly it predicts future success. A quarterback who produces the bulk of his offense only after the opponent starts trading short completions for time has not demonstrated the same thing as one who moves the chains against a defense still desperately trying to get a stop.
That does not justify erasing every losing-team touchdown or penalizing a quarterback for his defense's failures. Separate the score from the responsibility for the score. Identify the game-state threshold, publish the number of excluded plays, compare EPA and success rate, and look for evidence of real late comebacks. In every era, the biggest passing totals will draw attention. In 2026, we have enough play-level information to demand a better argument than the yardage number alone.
A bad NFL season cannot be rescued by a convenient box-score total. Nor should it be condemned by a simplistic garbage-time label. The only credible verdict comes from evaluating the competitive snaps, the game-changing decisions and the context around both.
GOATIFY
GOATIFY NFL
Explore six GOATIFY NFL fan favorites, selected by the GOATIFY product registry for football fans.